Smart Rings Vs Watches
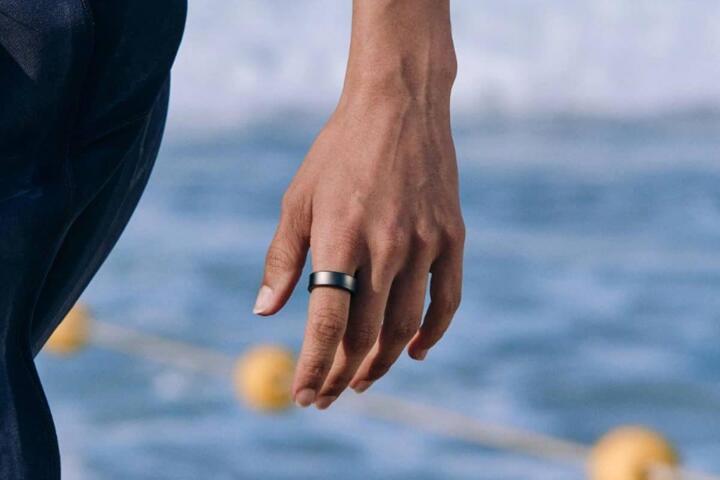
Smart rings and smart watches both measure body signals, yet their sensor types and placement differ enough to change what the data can reliably reflect. A ring typically houses sensors on the finger, where blood flow and motion patterns differ from the wrist. A watch places sensors on the wrist, where skin thickness, hair, sweat, and arm movement can affect optical readings and motion estimates.
In practice, the same “heart rate” label can come from different measurement pipelines. Many devices use optical sensors for heart rate and blood oxygen, while both also use motion sensors for activity and sleep-related movement. The ring’s smaller form factor often limits the number of sensors and the size of the optical window, which can influence signal quality during low perfusion or heavy motion.
People often compare devices by looking at daily graphs. Those graphs can diverge because each device estimates physiology from different raw signals, uses different filtering, and updates at different intervals. A ring may show smoother trends during quiet periods, while a watch may capture more frequent changes during workouts, depending on how the device samples and classifies motion.
Where Readings Go Wrong
Many misunderstandings come from treating sensor outputs as direct measurements of a single biological variable. Optical heart-rate sensors estimate pulse timing and blood volume changes in skin microvasculature. That estimate depends on light absorption by hemoglobin, stable contact pressure, and minimal interference from motion.
Finger placement changes the optical signal. The finger has smaller blood vessels and can show lower perfusion during cold exposure or stress. When perfusion drops, the optical signal-to-noise ratio can fall, which may cause heart-rate gaps or sudden jumps. Wrist placement also has variability, but the wrist often maintains better perfusion than the finger in many everyday conditions.
Motion is another common failure mode. During running, cycling, or even brisk walking, wrist motion can be large and frequent. Rings move less relative to the body during arm swings, but the finger can still move with grip, typing, or hand gestures. Optical sensors can misinterpret motion artifacts as pulse changes, especially when the device’s algorithm cannot separate rhythmic movement from cardiac pulsatility.
Sleep tracking adds extra complexity. Many devices infer sleep stages from heart-rate variability patterns, respiratory-related signals, and movement. If the sensor quality drops during the night, the device may smooth or reclassify data, which can shift time spent in light versus deep sleep. Stress scores and “readiness” metrics often combine heart-rate trends with activity and sometimes skin temperature, then apply proprietary models that are sensitive to baseline differences between individuals.
Consequences of misinterpretation are usually practical rather than medical. Overreacting to a single low oxygen reading, chasing day-to-day fluctuations in stress scores, or assuming two devices measure the same physiology can lead to unnecessary anxiety. Conversely, ignoring consistent symptoms and relying on wearable trends can delay appropriate medical evaluation.
Biologically, the signals differ even when the labels match. Heart rate reflects cardiac output and autonomic tone. Blood oxygen reflects arterial oxygen saturation and can be affected by sensor placement, peripheral perfusion, and ambient conditions. Skin temperature reflects local blood flow and sweat, which can change with room temperature, exercise, and circadian rhythm.
How Sensors Differ
Optical heart-rate sensors in both rings and watches typically use green and sometimes red light-emitting diodes with photodiodes to detect changes in reflected light. The device then estimates pulse rate from periodic fluctuations. Some models also estimate blood oxygen using additional wavelengths and ratio-based calculations, which are more sensitive to motion and perfusion than heart rate.
Placement changes the optical path length through tissue. On the finger, the optical signal may be more influenced by local vasoconstriction and less by subcutaneous fat distribution. On the wrist, the optical signal can be influenced by tendon movement, skin contact angle, and the presence of hair or uneven pressure.
Motion sensing usually relies on accelerometers, sometimes gyroscopes. Watches often include more robust motion sensing because the device can be larger and may support additional sensor fusion. Rings can still track steps and activity well, but the algorithm may rely more heavily on finger-specific motion patterns, which can differ from arm swing-based step detection.
Some rings and watches include skin temperature sensors. Temperature readings are local and can drift with ambient temperature, clothing, and sleep environment. A ring may show faster changes during hand exposure to cold or warm air, while a watch may show slower changes due to the wrist’s insulation and contact area.
Battery and sampling trade-offs also matter. Smaller devices may sample at different rates to manage power. If a ring samples heart rate less frequently during inactivity, it may miss brief spikes. If a watch samples more frequently, it may show more granular changes but also more opportunities for artifact-driven spikes.
Choosing Based On Goals
Match Sensor Quality To Use
Start by deciding which signals you care about most. If your primary goal is consistent heart-rate trends during daily life, prioritize stable optical contact. In practice, a ring should fit snugly without spinning, and a watch should sit firmly with the sensor centered on the skin. Check readings during a short test: compare heart-rate stability while sitting still, then while typing or walking. If the device shows frequent dropouts during low-motion periods, optical quality may be limited for your skin and finger size.
Why this works: optical sensors depend on consistent contact pressure and adequate perfusion. What it looks like: fewer “gaps” in heart-rate data during quiet time and fewer sudden jumps that do not match your activity. Tools and methods: use the device’s data view to look for missing segments, and compare with a manual pulse check for a few minutes if the device provides a heart-rate readout in real time.
Realistic outcome: you may still see occasional artifacts, but stable contact usually reduces them. No wearable can guarantee perfect readings during cold exposure, heavy motion, or irregular skin contact.
Plan For Sleep And Recovery
If sleep tracking matters, compare how each device handles nights with different conditions. Wear the device for several nights in the same environment, then compare total sleep time and the pattern of heart-rate trends across the night. In practice, watches often show more consistent sleep metrics for people who keep the device snug and avoid sensor slippage. Rings can work well, but finger temperature and perfusion can vary more with room temperature and bedding contact.
Why this works: sleep staging models rely on heart-rate variability and movement patterns, which degrade when optical signals are noisy. What it looks like: fewer abrupt stage changes and more consistent heart-rate decline during the first part of sleep. Tools and methods: review “signal quality” indicators if the device provides them, and compare trends over a week rather than judging one night.
Realistic outcome: sleep stage percentages can differ between devices even when both are functioning correctly, because staging algorithms are not identical. Use sleep trends to spot direction changes, not to treat stage counts as a direct measurement of physiology.
Use Activity Metrics Correctly
For steps and workouts, focus on consistency with your movement style. Watches often detect steps using arm swing, which can be reliable for walking and running. Rings detect steps using finger motion and may perform differently during activities with limited hand movement, such as cycling with a steady grip or carrying items that restrict finger motion.
Why this works: motion sensors feed classification models that map movement patterns to activity categories. What it looks like: step counts that track your typical daily range and workout heart-rate curves that rise during exertion. Tools and methods: compare wearable step totals with a known baseline such as a short walk where you count steps manually or use a treadmill display for a single session.
Realistic outcome: step counts can differ by 5–20% between devices for some users, especially when hand movement patterns differ. Heart-rate during exercise may be closer than step counts, but optical sensors can still struggle during high-intensity motion.
Interpret Oxygen And Temperature Cautiously
If you plan to use blood oxygen (SpO2) or skin temperature features, treat them as trend indicators rather than direct clinical readings. In practice, SpO2 estimates can be affected by motion, cold fingers, and loose fit. Skin temperature can shift with room temperature, blankets, and exercise timing.
Why this works: both signals depend on local physiology and sensor conditions. What it looks like: SpO2 readings that are stable at rest but fluctuate during movement, and temperature curves that mirror your sleep environment. Tools and methods: look for patterns across multiple nights and avoid reacting to a single low reading unless it matches symptoms and persists.
Realistic outcome: wearables can be useful for noticing trends, but they are not a substitute for medical-grade pulse oximetry when accurate oxygen saturation measurement is needed.
Educational Case Examples
Case: Cold Mornings And Heart Rate
A person compares a ring and a watch on a cold morning. The watch shows continuous heart-rate data during a 20-minute walk, while the ring shows intermittent dropouts and occasional spikes. The person repeats the test indoors at a warmer temperature and sees fewer ring gaps. The difference aligns with optical perfusion sensitivity: finger blood flow can decrease more in cold conditions, reducing signal quality.
Case: Sleep Staging Differences
A person tracks sleep for a week with both devices. Total sleep time looks similar, but the ring assigns more time to light sleep while the watch assigns more to deep sleep. The heart-rate trend across the night remains similar in both devices, suggesting the staging model differs rather than the underlying sleep physiology changing dramatically. The person focuses on week-to-week changes instead of comparing stage percentages day to day.
Comparison Checklist
| Decision Factor | Ring Tends To | Watch Tends To | What To Check |
|---|---|---|---|
| Heart-rate stability at rest | Can be strong with good fit; may drop in cold or low perfusion | Often stable if snug on the wrist; can be affected by hair/sweat | Look for missing segments and sudden spikes during quiet time |
| Heart-rate during motion | May handle arm-swing motion well; finger motion can still cause artifacts | Can show granular changes; wrist movement can increase optical artifacts | Compare curves during the same workout type across devices |
| Sleep staging | May vary with finger perfusion and temperature | Often consistent if sensor stays aligned overnight | Judge trends over a week, not single-night stage percentages |
| Steps and activity | May differ for cycling, carrying items, or limited hand motion | Often strong for walking/running with typical arm swing | Validate with one controlled session and then use relative trends |
| SpO2 and temperature | More sensitive to finger perfusion and fit | Sensitive to motion and sensor contact; may be steadier for many users | Treat as trend data; avoid reacting to one outlier |
Common Mistakes
One mistake is comparing ring and watch numbers as if they share the same measurement method. Even when both devices estimate heart rate from optical signals, their sampling rates, filtering, and artifact rejection differ, so exact agreement is unlikely.
Another mistake is wearing the device loosely. A watch that shifts on the wrist or a ring that spins can reduce optical contact and increase motion artifacts. Fit issues often show up as missing heart-rate segments or noisy sleep graphs.
A third mistake is judging performance after only one day. Sensor behavior stabilizes after a few days as you learn how the device sits on your skin and how your routine affects motion and perfusion.
People also overinterpret oxygen and stress scores. SpO2 estimates can fluctuate with movement and cold exposure, and stress scores are model outputs that depend on baseline heart-rate variability and activity patterns.
Finally, some users ignore symptoms and rely on wearable trends. Wearables can be helpful for context, but persistent symptoms such as chest pain, fainting, severe shortness of breath, or sustained abnormal readings should be discussed with a clinician.
FAQ
Do Rings Measure Heart Rate Differently?
Rings and watches both commonly estimate heart rate using optical sensors, but the finger versus wrist placement changes perfusion and motion artifacts, so the same heart-rate label can show different noise patterns and sampling behavior.
Why Do Two Devices Show Different Sleep Stages?
Sleep stages are inferred from signals like heart-rate variability and movement using proprietary models, so stage percentages can differ even when total sleep time and heart-rate trends look similar.
Are Blood Oxygen Readings Reliable On Both?
SpO2 estimates are sensitive to motion, fit, and local blood flow. A device may look stable at rest but fluctuate during movement or in cold conditions, so trends across nights matter more than single readings.
Which Tracks Workouts Better?
Workout accuracy depends on how the device handles optical motion artifacts and how your activity moves the sensor. Watches often perform well for walking and running, while rings can vary based on finger motion during grip and arm use.
How Should I Compare Devices Fairly?
Compare trends over several days, validate with one short controlled session for steps or heart rate, and focus on consistent patterns rather than exact day-to-day agreement.
Author's Insight
Smart rings and smart watches share core sensor concepts—optical light detection for pulse and motion sensors for activity—but placement and sampling strategies change the signal quality. Finger-based optical measurements can be more sensitive to cold and fit, while wrist-based measurements can be more sensitive to hair, sweat, and sensor shifting. Sleep staging and stress outputs depend on algorithmic interpretation of these signals, so device-to-device differences often reflect model design rather than true physiology changing in opposite directions. For consumer decisions, the most useful approach is to test sensor stability in your routine and interpret outputs as trends, not direct clinical measurements.
Key Takeaways
- Rings and watches often use similar sensor types, but finger versus wrist placement changes perfusion and motion artifacts.
- Heart-rate graphs can disagree due to sampling rates, filtering, and artifact rejection, even when both devices work correctly.
- Sleep stages and stress scores are model outputs; compare week-to-week trends rather than single-night stage percentages.
- Validate with a short routine test for your priorities, then interpret oxygen and temperature as trend indicators.
- Wearables support context, not medical diagnosis; persistent symptoms require clinical evaluation.