How BIA Smart Scales Work
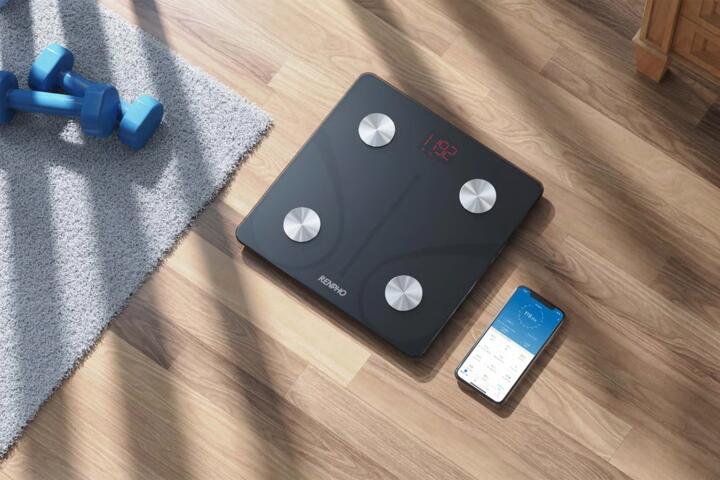
Smart scales with bioelectrical impedance analysis (BIA) send a low-level electrical current through the body and measure resistance and reactance. Lean tissue contains more water and conducts electricity better than fat tissue, so the device converts electrical properties into estimates of body composition.
Most consumer scales use foot-to-foot BIA, which estimates body composition using measurements from the soles of the feet. Because the current path is limited to the lower body, the results are indirect estimates of whole-body fat and lean mass rather than direct measurements.
The scale’s software also applies assumptions about body geometry and tissue hydration. Those assumptions can hold reasonably well for some people on some days, but they break down when hydration status, recent activity, or meal timing changes.
In practice, the scale reports numbers such as body fat percentage, fat mass, lean mass, and sometimes “water” metrics. These outputs are best treated as estimates that can track trends, not as exact values of tissue composition.
Why Readings Drift Over Time
People often treat day-to-day changes as true changes in fat or muscle. BIA estimates, however, respond quickly to water shifts. A person can see a body fat percentage change after a salty meal, a hard workout, or poor sleep even when actual fat mass has not changed meaningfully.
Hydration is the main driver of BIA variability. When total body water increases, resistance typically decreases, which can make lean mass appear higher and fat mass appear lower. When hydration decreases, the opposite pattern can occur.
Food intake affects measurements because digestion and fluid distribution change conductivity. Even without major weight change, the electrical properties of the body can shift after eating.
Exercise changes water distribution through muscle inflammation and glycogen-related water retention. The scale may reflect these short-term shifts rather than changes in tissue composition.
Skin contact and electrode conditions matter. Dry, callused, or cold feet can increase contact resistance and alter readings. Sweat and good contact tend to reduce variability, while inconsistent contact increases measurement error.
Device-to-device differences also contribute. Two scales using different electrode designs, current frequencies, and proprietary algorithms can produce different body fat percentages for the same person under the same conditions.
Finally, BIA accuracy is not uniform across populations. Age, body size, and the presence of edema or dehydration can change how well the device’s assumptions match the body’s electrical behavior.
What Accuracy Means for BIA
Measurement error is the gap between the scale’s estimate and the true value. For consumer BIA, error can be large enough that single readings should not be used to judge progress or to infer health status.
Even when the device is consistent, the estimate can move because the body’s hydration and fluid distribution move. That means the scale can show “improvement” or “worsening” without a corresponding change in fat tissue.
For many users, the most reliable use is tracking trends under tightly controlled conditions. If the same person measures at the same time of day, under similar hydration and contact conditions, the direction of change can be informative even if the absolute numbers are imperfect.
It helps to separate two questions: “Did my body composition change?” and “Did my scale reading change?” BIA readings can change faster than fat mass, so the second question is easier to answer than the first.
How To Reduce Measurement Error
Standardize Time, Food, And Hydration
Measure under consistent conditions to reduce day-to-day variability. A practical approach is to weigh at the same time each morning, after using the bathroom, before eating or drinking. This reduces the influence of recent meals and fluid shifts.
Keep hydration patterns consistent. If you drink much more water on some days, the scale may show lower resistance and a different body composition estimate even if fat mass is unchanged.
In practice, aim for a repeatable routine for at least 1–2 weeks before judging trends. If you change your routine, treat the new period as a new baseline rather than comparing directly to earlier readings.
Relevant tools include a simple log (date, time, sleep duration, workout yes/no, and any unusual factors like alcohol or long travel) and a consistent measurement schedule.
Realistic outcome: with a stable routine, many users can reduce random fluctuations enough to see smoother trends, but the scale still cannot guarantee accurate absolute body fat values.
Control Temperature And Contact
Cold feet and poor electrode contact can raise resistance and distort estimates. Use the scale on a stable surface and ensure the feet are clean and dry enough to make consistent contact.
If the scale has removable electrodes or requires wiping, keep the cleaning method consistent. Avoid measuring immediately after applying lotions or creams to the feet, since residue can change conductivity.
In practice, warm up before weighing if you tend to have cold extremities. Some people find that measuring after a brief indoor warm-up reduces variability.
Relevant tools include a bathroom towel for consistent drying and a routine for cleaning electrodes according to the manufacturer’s instructions.
Realistic outcome: contact-related error can be noticeable, especially in winter or for people with dry skin, so improving contact consistency often improves repeatability.
Use Trends, Not Single Numbers
Body fat percentage and lean mass estimates from BIA can fluctuate even when fat tissue changes slowly. Use multi-day averages rather than reacting to a single day’s reading.
A practical method is to record daily weights and BIA outputs, then compare the average of the last 7 days to the average of the previous 7 days. This reduces the impact of short-term water shifts.
In practice, if your weight changes but your BIA body fat percentage swings dramatically, consider that hydration and meal timing may be driving the BIA estimate. Pair BIA trends with other signals such as waist measurement, strength training progression, and how clothing fits.
Relevant tools include a spreadsheet or app that calculates rolling averages and a tape measure for waist circumference taken under consistent conditions.
Realistic outcome: trend-based interpretation can better reflect longer-term changes, but it still cannot separate fat loss from water changes with certainty.
Know When BIA Data Is Less Trustworthy
Some situations increase the chance that BIA assumptions do not match the body. Examples include significant dehydration, heavy alcohol intake, edema, fever, or rapid fluid shifts from illness.
Recent intense exercise can also make BIA less interpretable for a day or two because of inflammation and glycogen-related water retention.
In practice, if you had a long flight, a very salty meal, or a hard workout the day before, treat the next measurement as potentially “noisy.” You can still record it, but you should weigh it less when interpreting trends.
Relevant tools include your measurement log and a rule such as “exclude days with unusual conditions from the 7-day average.”
Realistic outcome: excluding clearly unusual days can improve the signal-to-noise ratio, though it reduces the amount of data you use.
Educational Case Examples
Example 1: Salt And Post-Meal Shifts
A person measures every morning before breakfast for two weeks. After a weekend with higher-salt restaurant meals, the scale shows a higher body weight and a lower estimated body fat percentage for several days. The person’s waist measurement changes minimally and strength training performance stays stable. The pattern fits a hydration-driven BIA shift rather than rapid fat loss.
After returning to the usual routine, the readings gradually return toward the prior baseline. The person focuses on the 7-day averages rather than the weekend spikes.
Example 2: Training-Induced Water Changes
A person starts a new resistance training program. For the first week, the scale shows small increases in lean mass estimate and body fat percentage changes that do not match how clothing fits. The person also experiences muscle soreness and notices that measurements are more variable after training days.
By keeping the same measurement time and comparing rolling 7-day averages, the person sees a steadier trend over subsequent weeks. The early fluctuations are treated as likely water and inflammation effects rather than true tissue changes.
BIA Checklist For Daily Use
| Step | What To Do | Why It Reduces Error | What You Should Expect |
|---|---|---|---|
| Measure at the same time | Morning before eating, after bathroom | Limits meal-related conductivity changes | Less day-to-day scatter |
| Keep hydration consistent | Avoid large swings in fluid intake | Reduces water-driven resistance changes | More stable body fat estimates |
| Improve electrode contact | Clean, dry feet; no lotions; warm if cold | Lowers contact resistance variability | Better repeatability |
| Use averages | Compare 7-day averages, not single days | Smooths short-term water fluctuations | Trends that match real changes better |
| Flag unusual days | Note illness, heavy alcohol, long travel, hard training | BIA assumptions fit worse during fluid shifts | Fewer misleading trend changes |
Common Mistakes With Smart Scales
Measuring at different times of day is a frequent error. Body water and fluid distribution change across the day, so comparing afternoon readings to morning readings often exaggerates differences.
Reacting to day-to-day body fat percentage changes is another mistake. Fat tissue changes slowly, while BIA estimates can shift quickly with hydration and meal timing.
Using multiple scales interchangeably can confuse interpretation. Different electrode layouts and algorithms produce different estimates, so trends should come from one device under one routine.
Ignoring skin contact issues can add noise. Measuring with wet feet, lotion residue, or very cold feet can change resistance independent of body composition.
Changing measurement conditions during a “test period” undermines conclusions. If you start a new diet, change workout timing, or alter sleep patterns, BIA readings may reflect those changes in water balance rather than tissue composition.
Over-interpreting “water” metrics can also mislead. Many consumer scales estimate hydration indirectly, and the numbers may not match clinical hydration status.
FAQ
How accurate are BIA smart scales?
Consumer BIA provides estimates with meaningful error. Accuracy varies by hydration status, contact quality, and the device’s assumptions, so single readings should not be treated as exact body fat or lean mass values.
Why does my body fat percentage change when my weight stays similar?
BIA responds to changes in body water and fluid distribution. A similar scale weight can still coincide with different resistance measurements, shifting the estimated body fat percentage without a large fat tissue change.
Should I weigh daily or only occasionally?
Daily weighing can help identify trends, but interpretation should rely on averages over several days. Occasional weighing can miss short-term patterns and make it harder to distinguish routine variability from real change.
Do workouts affect BIA readings?
Yes. Exercise can change water distribution through glycogen storage and inflammation, which can alter resistance and reactance. Measurements taken soon after training may be less comparable to measurements taken on rest days.
Can I compare my results to someone else’s scale?
Comparisons across people are limited because BIA estimates depend on device algorithms and individual hydration patterns. The most reliable comparisons are within the same person using the same device under consistent conditions.
Author's Insight
BIA smart scales estimate body composition indirectly by translating electrical resistance into tissue hydration and composition assumptions. The largest source of error for home users is not random noise; it is systematic change in body water that alters the electrical signal faster than fat or muscle tissue changes.
For informed tracking, the practical goal is repeatability: consistent timing, contact conditions, and hydration patterns. When those conditions are stable, trend interpretation becomes more informative even though absolute numbers remain estimates.
When readings conflict with other measurements such as waist circumference or how clothes fit, hydration-driven BIA variability is a common explanation. Treat the scale as one data stream rather than a definitive measurement of tissue composition.
Key Takeaways
- BIA smart scales estimate body fat and lean mass from electrical resistance, using assumptions that can fail when hydration and fluid distribution change.
- Day-to-day fluctuations often reflect water shifts from meals, exercise, sleep, and contact quality rather than true fat or muscle changes.
- Use consistent measurement conditions and compare 7-day averages instead of reacting to single readings.
- Improve electrode contact and keep routines stable; treat unusual days as potentially noisy data.
- Interpret BIA alongside other indicators and avoid using it as a precise measure of body composition at any one moment.